The idea of what a ‘family’ looks like has changed a lot over the years. From the stereotypical nuclear family to same-sex parents or lone parenting, every family is unique and special in their own right. Children love to play ‘families’ with their toys, especially if they have a dolls pram to reenact pushing around a young one as their parents do.
But what have been the major changes in British families over the last five years? By analysing ONS reports, we’ve created a family index that looks into how families and the ‘home unit’ have changed over time.
The presence of children differs in family types
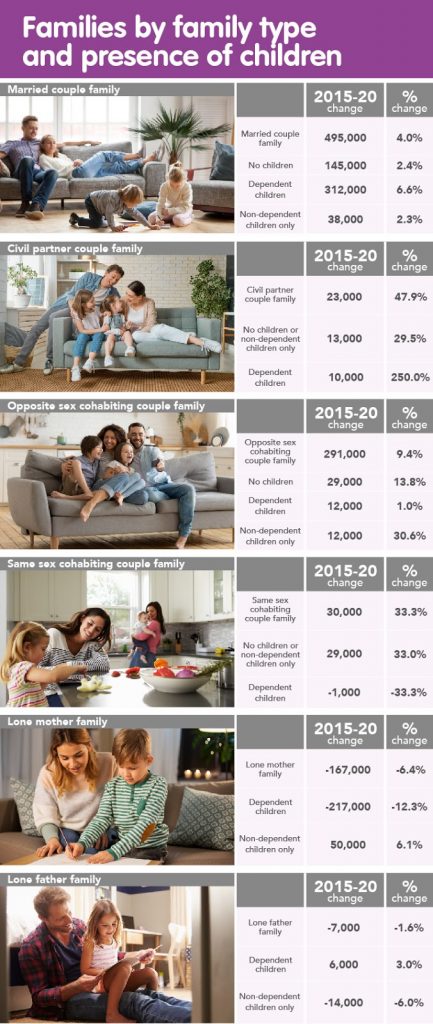
Looking at six different family types that are found throughout the UK, we found that married-couple families had increased by 4% between 2015 to 2020, but civil partner couple families had increased by almost 50%, with a significant increase since 2019, when opposite-sex couples were also allowed to enter civil partnerships.
Same-sex cohabiting couple families have also drastically increased in comparison to opposite-sex cohabiting couple families, with respective increases of 33.3% and 9.4% of these family units. Interestingly though, cohabiting couples of the same and opposite sex, have both seen an increase in the number of families without children, rising by 33.3% and 13.8% respectively.
From 2015 to 2020, there has been an overall decrease in lone-parent families, with lone mother families having a greater reduction (-6.4%) than lone father families (-1.6%)
Couples are preferring to have two children whereas lone parents are more likely to have three or more children
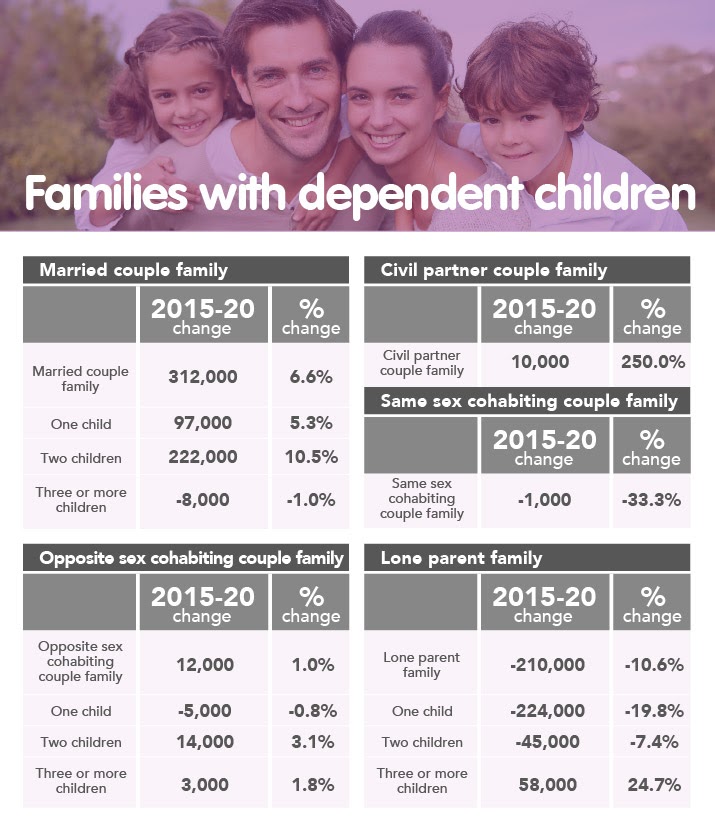
When comparing family units with dependent children, our research found that for married and cohabiting couples, the greatest changes come in the increase of families with two children (10.5% increase in these family units from 2015 to 2020).
In comparison, lone parent family units have seen three or more children families increase by almost a quarter (24.7%), yet lone-parent families with just one or two children have decreased significantly (-19.8% and -7.4% respectively).
No matter the number of children your family has though, engaging them in imaginative play has numerous benefits to their development. No matter your child’s age, playing house is a fun way for your kids to act out their own little family and really feel involved with the family unit. If your kids have toy dolls, why not pair them with their very own double dolls pram or dolls high chair so they can role-play being parents to their dolls.
Increase in households with four people but two-person households are the most common
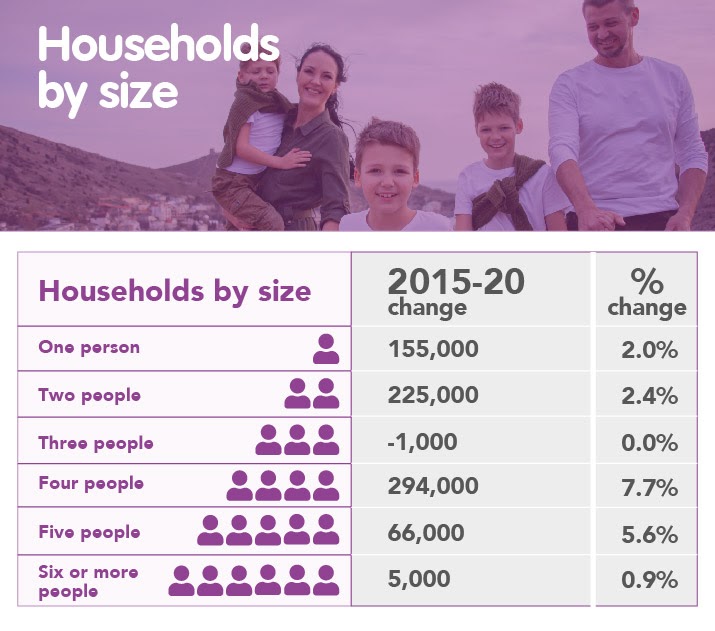
Looking at households by size, the most common household size in the UK in 2020 consists of two people (9,675 thousand households). However, from 2015 to 2020, households with four people saw the greatest percentage increase, with 7.7%.
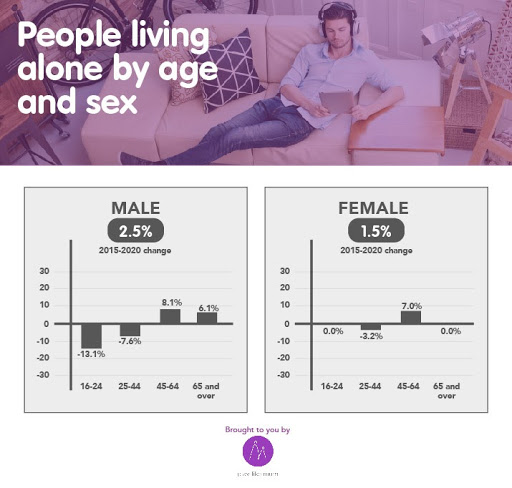
Men are more likely to live alone than women
Breaking down our research to look at people living alone by age and sex specifically, we found that men of the UK population are more likely to be living alone in comparison to women.
Interestingly, of both men and women, the age group that is most likely to be living alone is 45-64 years old which has seen an 8.1% increase in male solo households and a 7% increase in female solo households.
Methodology
All data sourced was from the Office of National Statistics ‘Families and households’ dataset, which is a part of the Labour Force Survey and relates to the most recent period in which data is available (2015 to 2020) for UK households.
To work out the households by region, data was taken from the Office of National Statistics ‘Households by type of household and family, regions of England and UK constituent countries’ dataset. This dataset also relates to the most recent period in which data is available (2015 to 2020) for UK households.

